Meteorologist Andy Gregorio's blog for the weather conscious, weather curious, and weather geek..
Aug 1, 2021
July Weather Summary for Glens Falls
The average monthly temperature was 67.7° at the airport which was 2.0° BELOW normal; at my location it was 69.1° or 0.6° BELOW normal. In addition to the cooler temperatures the month did not record a temperature of 90°. The last time that a July went without a 90° was 2017. Below is a more detailed breakdown of July 2021's weather in Glens Falls. Addition to the above: From the NWS Albany The numbers are in! July ended up being the 3rd wettest for Albany (8.96") and Glens Falls (8.06"), and 13th wettest for Poughkeepsie (6.06"). In fact, the 8.96" that fell in Albany was the 10th wettest month of all time! The 8.06" for Glens Falls was also the 10th wettest month on record.
Dec 20, 2020
Record snowfall for Glens Falls?
The snow storm of December 16-17, 2020 was definitely one for the record books. If not for the most snow from a single storm, definitely one for the greatest amount of snow to fall in a 24 hour period. (Then again most of the snow fell in 12 hours!)
After researching climate data from the Northeast Regional Climate Center (NRCC) for Glens Falls I have come up with the following:
First there are big "time gaps" in the data. The climate database now includes a hodge-podge of weather observations from various locations around but close to Glens Falls; that is the new database includes records from more than the current "official" site for Glens Falls - the Warren county airport (aka Floyd Bennett Memorial Airport).
With the expansion of the database using other sites within the "Glens Falls region" now allows for records to be extended back to 1893. But once again as I stated above there are huge gaps of months, weeks and YEARS in using this data set. So when and if new "missing" data is uncovered much of my quick research is subject to change.
But for NOW, using the current database as it exists this is what I have come up with:
For the month of December the storm of the 16th and 17th was a record for the following categories:
1) A daily snowfall record on the 17th - 32.5"
2) The most snow to have fallen in a 24 hour period for any given month.
3) A Dec. Snowstorm record: - 33.8" (1.3" observed on the 16th prior to midnight). The previous record was 18" set on Dec 14th-15th, 1915.
In terms of all-time snow storms, again using the database going back to 1893 (snowfall record for the period from 1893 through 2020), the snowfall from the December 16th-17th storm would rank as the top storm of all-time for Glens Falls. The total was 33.8"; the previous record was 33" of snow measured on February 14, 1914.
Apr 25, 2018
Cutting the Cable Cord
Based on the report that you got from TV Fool you have to figure out your location relative to the transmitters to properly “point” the antenna. For example, I live to the north of the transmitters so I have to have my antenna facing toward the south. After you “point” your antenna in the proper direction the next step is its location or placement in/on your home. The general rule here is the HIGHER UP the better the signal reception.
-
OTA indoor antenna
-
Amazon TV Firebox (attached to TV downstairs)
-
Roku stick (attached to TV upstairs)
-
ISP
While I was waiting the arrival of the RS (which came 3 days later), I began to “experiment” with this antenna.This part of going cable-free is probably the most tedious part of the project. It involves a bit of trial and error and it also involves knowing a bit about TV signal propagation.
Now, one of the drawbacks to this antenna is that the coaxial cable was only 16 feet long and it is NOT detachable from where it connects into the antenna. So I then went upstairs to my study-office-Man Cave where TV #2 is located. I placed the antenna in the window, had my TV perform a channel scan and bingo I got additional TV stations but not all (based on what the TV Fool report said I should receive. See image below).
Since my OTA antenna was not getting ALL of the local channels (by the way – when I say all of the local channels, I mean the primary channels [for me WNYT, WRGB, WTEN, and PBS, along with all of their associated subchannels, too], I decided to purchase a Mohu Leaf (indoor) antenna. This one afforded me more options and it was highly rated too. The cost was $50 (at Wal-Mart). One of the advantages of this antenna is that the antenna cord is detachable where it hooks into the back of the antenna.
So I brought the Mohu to the attic. I replaced the 10 feet of cable with 50 feet. I placed the antenna in the east window did a channel scan and once again a few more stations came in but still not all of them. Next step I tried the south window, did another channel scan and yes I struck gold, I finally got all of the stations!
As you can see the tedious part of this procedure is having to find the best location for your antenna and then do the channel scans to see if you are getting all the stations that you're "supposed" to get. However, it is worth the effort to perform these.
Sling, Netflix, Hulu, AirTv and Pluto TV (check this app out its pretty cool and its FREE) are installed on my RS and Firebox. On the RS I also have the Roku Channel app. I also have Amazon Prime, too but I rarely use it for watching TV shows or movies.
- Internet access,
- an OTA antenna,
- a Roku Stick or Amazon Firebox
- additional apps.
Also note that I did not include phone service in my monthly expenses. I do not have phone service through my cable provider but I do have internet phone service. It only costs me $3.75/ month. If you want good internet phone service know, that like with NO CABLE TV in your house, there are many excellent options available to you that are both good and inexpensive if not FREE! But to talk about them now would just make this already long post even longer. So I will make that another blog for another another day and time.
If you have any questions about cutting the cord start by GOOGLING them. Trust me its not a difficult project to DIY.
Jan 12, 2018
A LIST OF DEEP FREEZES AT GLENS FALLS, NY
The most recent deep freeze from Dec 25th, 2017 through January 8, 2018 was a 15 day freeze. The last time a freeze of 15 days occurred was Dec 08-22, 1981.
|
Jan 3-Feb 11, 1985
34 Days
Dec 16, 1969-Jan 16, 1970
29 Days
Jan 14-Feb 11, 1948
28 Days
Dec 22, 1976-Jan19, 1977
27 Days
January 27-Feb 22, 1978
Jan 25- Feb 20, 2007
Jan 26-Feb 21, 2015
24 Days
Jan 8-31, 1982
23 Days
Dec 8-30, 1989
Dec 19, 2000 – Jan 10, 2001
Jan 6 – 28, 2001
22 Days
Jan 30-Feb 20, 1979
21 Days
Jan 2-22, 1945
20 Days
Feb 2-21, 1958
Feb 7-26, 1968
Dec 30, 1968-Jan 17, 1967
Jan 21-Feb 9, 1977
Jan 24-Feb 12, 1980
|
14 Days
Dec 11-24, 1945
Jan 10-24, 1978
Jan 17-30, 1987
13 Days
Jan 24 – Feb 5, 1955
Jan 2-14, 1974
Jan 1-13, 1976
Jan 19-31, 2008
12 Days
Dec 7-18, 1958
Jan 22-Feb 2, 1963
Nov 30-Dec 10, 1964
Dec 7-18, 1958
Jan 22-Feb 2, 1963
Nov 30-Dec 10, 1964
Dec 20, 1970 – Jan 2, 1971
Feb 1-12, 1974
Jan 15-26, 1976
Dec 23, 1983 – Jan 3, 1984
Dec 12-23, 1985
Feb 9-20, 1987
Feb 18- Mar 1, 1993
Jan 1-12, 1996
Jan 29-Feb 9, 2010
Jan 6-17, 2015
|
11 Days
Jan 14-24, 1946
Jan 26-Feb 5, 1951
Jan 4-14, 1954
Dec 22, 1966 – Jan 1, 1967
Feb 7-17, 1967
Feb 26-Mar 8, 1978
Jan 3-13, 1979
Feb 22-Mar 4, 1982
10 Days
Feb 18-27, 1946
Jan 24-Feb2, 1957
Feb 7-16, 1962
Jan 28-Feb 6, 1965
Jan 18-27, 1970
Jan 27-Feb 5, 1971
Dec 26, 1977 – Jan 4, 1978
Jan 13-22,1983
Feb 2-11, 1989
Jan 3-12, 1994
Jan 14-23, 1994
Dec 16-25, 2009
Jan 21-30, 2014
Feb 04-13, 2014
|
19 Days
Dec 31, 1980-Jan 18, 1981
18 Days
Jan 19 – Feb 5, 1945
Dec 27, 1967 – Jan 13, 1968
Jan 30-Feb 16, 1994
17 Days
Jan 24- Feb 9, 1961
16 Days
Jan 25-Feb 9, 1961
Dec 14-29, 1980
Jan 8-23, 1984
Jan 30/31-Feb 16, 1994
Dec 7-22, 1995
15 Days
Dec 08-22, 1981
Dec 25, 2017- Jan 8, 2018
|
Jan 8, 2018
The Cryogenic Climate of Glens Falls New York
For the longest I have wanted to organize a climatology database for this location using data from the Northeast Regional Climate Center (NRCC). Things that I wanted to do were show what were the warmest or coldest, wettest of a particular holiday or what was the longest heat wave for the site and so on. I started working on heat and heat waves for this location but be became sidetracked. Considering the cold wave we're going through now, it may not be a bad idea to continue this heat project but instead I decided to work on some of the colder aspects of the Glens Falls airport.
The Cold Facts
Our Current Cold Snap/"Deep Freeze"
Northeast Regional Climate Center NOWDATA for Glens Falls Airport. Access to the NOWDATA site through the following link : NRCC Regional Climate Data
Dec 31, 2017
The New Year's Weather
| ELEMENT | GLENS FALLS | ALBANY |
|---|---|---|
WARMEST TEMP
|
66°/2007
|
57°/1966
|
WARMEST AVG.
|
57.5°/1950
|
46.5°/1966 and 1979
|
LOWEST TEMP
|
-7°/1957
|
-18°/1970
|
LOWEST AVG.
|
-18.5°/1994
|
-3.5°/1918
|
WETTEST
|
2.55"/1999
|
0.95"/1935
|
SNOWIEST
|
15.7"/1986
|
9.2"/1961
|
Temperature records go back to 1874 for Albany and 1944 for Glens Falls. Regarding snowfall for Glen's Falls, snow observations ceased at the site in 2003 when the site went to an automated observation system . However, I do not recall any heavy snow on New Year's Day since then.
New Year's Day 2018 Forecast
Forecast for the rest of 1st week of 2018
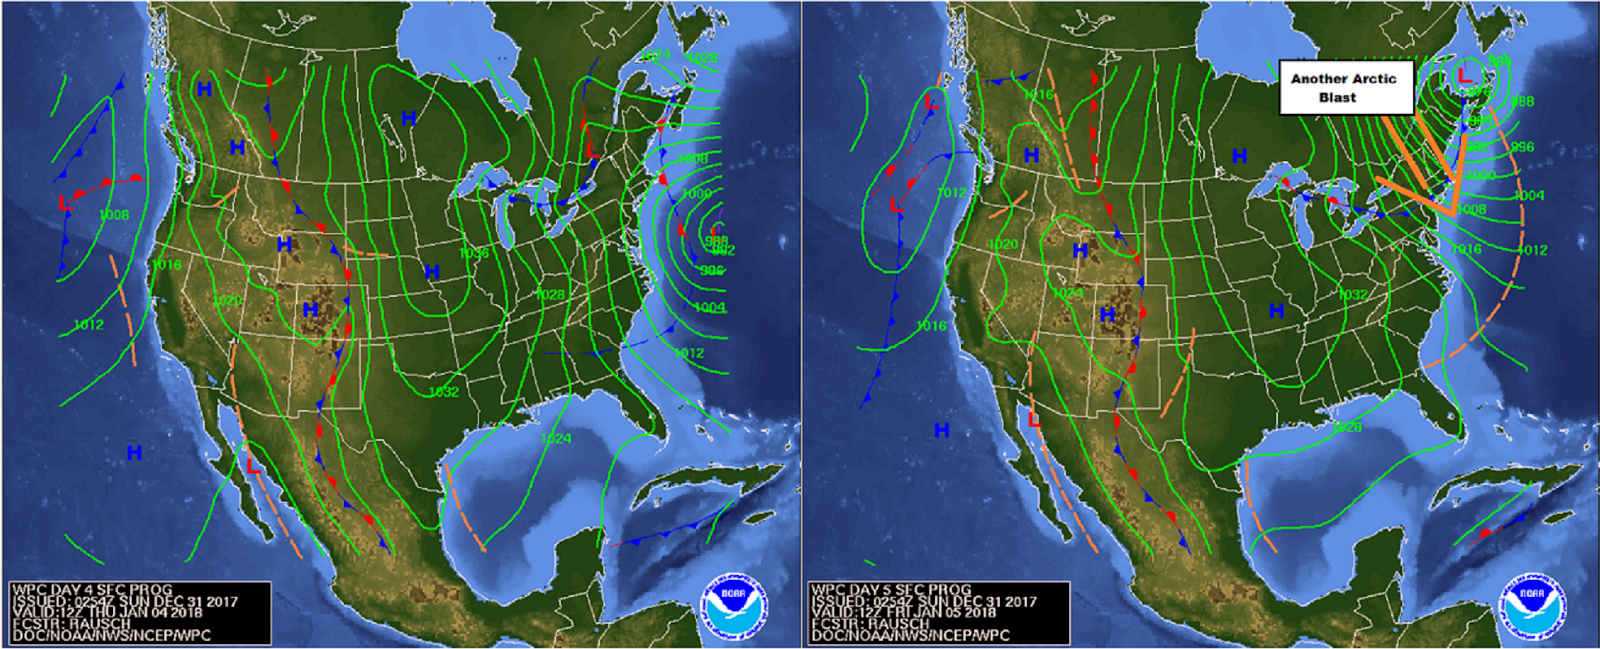
Also during Thursday through Friday a large storm is forecast to be moving north across the western Atlantic. At this time it looks like it will be too far east to cause us any significant snow.
However, the large circulation around the storm will cause a strong NW-N airflow to develop around its western perimeter. This flow of air will be from the arctic reaches of Canada so by the Friday into the next weekend we'll likely see (hard to believe) the coldest weather of this young winter season. It looks like more daytime highs in the digits or near 0 ° and widespread well below zero readings are likely during the nights. I can see the potential for readings near -20 to -25° Friday, Saturday and maybe next Sunday night at Glens Falls and across the Southern Adirondacks.
Deep Freeze
Climate date for New Year's Day and Deep Freeze dates courtesy of NWS Albany, NY
Dec 28, 2017
More Cold - er Weather On The Way
| (Fig.1) image from: www.geography.hunter.cuny.edu |
| (Fig.2) 28 Dec 2017 Snow on the Ground courtesy: |
However, thanks to an extensive snowpack across the interior parts of the Northeast and Great Lakes States north across Southern Canada (Fig.2) this air will modify VERY little. Thus, we can expect the very cold weather to continue into the new year. Through New Year's Day we can expect bitter cold high and low temperatures to persist averaging about 25° BELOW normal.
In addition, whenever we have even a slight breeze or stronger expect dangerously low wind chills to occur. Such will be the case through early tonight and again later Friday into Saturday (when it will be more of stiff wind vs. a gentle breeze). We'll also have more clouds on Friday through Saturday along with the chance for some periods of light snow or snow showers as a clipper moves through. With this low's passing brisk N and NW winds will kick in later Saturday along with a re-enforcing shot bitter and frigid air moving in for New Year's Eve and New Year's Day.
There is very little change to the temperature forecast through 2 Jan; The "relatively" warmest day will be on Saturday when temperatures will make into the teens (perhaps some 20° or low 20s south of Albany). Otherwise, daytime highs will be in the single numbers to 10° and nighttime lows well below zero.
Last but not least...there is the chance for a snowfall next week in the Wednesday through Friday period. I am already getting messages and emails regarding this possible snowfall. All I will say is that there is a possibility for snow. As is always the case track, intensity and speed of the storm (aka duration) will determine what we get or don't get. Be prepared for a lot of postings on this possible "storm" on Facebook, Twitter, Google+ or wherever else they are posted, to.
Remember: check the SOURCE of the post. If its just a map of some model's snowfall forecast I would discount it. ANYONE can post a map of some computer forecast model without having any knowledge of what they are posting. SHARE any posts responsibly, too. Finally, please don't ask me about what "others" are saying we're going to get. I can only speak for myself. Obviously I'll have more on this over the days to come. Hope everyone is staying warm.
Dec 26, 2017
Arctic Cold Wave on the Way
An if these very cold temperatures weren't bad enough when combined with periods of gusty winds in the forecast (like for tonight and Wednesday (Dec 27th) you can expect it to feel even colder , Expect wind chills ranging from -10° to -25°, with some of the higher terrain perhaps getting to -40°! Additional periods of blustery conditions late Thursday and again later Saturday into next Monday could result in more periods of extremely low and DANGEROUS wind chill conditions.
Stay warm! Remember to not leave your pets outside in the cold.
Dec 20, 2017
Meteorological Memories
She asked, "When was the last time you read or used that 'stuff'' ? Some of it looks like it is ancient!" I then paused and realized she made a valid point. (Okay, she was right.) So I began the massive cleanup (which I really did intend on doing along but my usual procrastination prevented me from doing so until now).
Some of these papers and booklets were indeed old! They were memories from my days as an "amateur" meteorologist. In the folders and binders are pamphlets and booklets that I purchased from the U.S. Government Printing Office in Washington, D.C. when I was 9 and 10 years old! (That makes them over 50 years old!!) For sentimental reasons I have kept them (and will keep them). In many ways these and all my other papers and books in my weather collection are my personal weather history of my years in weather AND also a history of the field of meteorology, itself.
What was in these folders and binders ? Some contained AMS Meteorological monographs, others had books, pamphlets and articles on assorted topics in meteorology (and oceanography, too which I studied as well, when I was in college). Some of the books and articles dealt with short and long range weather forecasting. Others were on topics like tropical meteorology and or hurricane forecasting. It was hurricanes taht got me interested in meteorology. It was my faint recollections of Hurricane Donna that peaked my interest in weather.
Other papers in my collection dealt with topics such as: atmospheric (planetary waves), severe weather, winter weather case studies and forecasting of such for various parts of the U.S. including the Northeast. Some of these papers were from my college days back in the early 70s. They were required reading for my studies; some of the more recent ones were procured for personal research for projects that I either did or intended to do (and still hope to do). I also found my two research papers that I did on severe weather for the area: One on the Mechanicville Tornado that occurred in May of 1998 and the other on an early morning severe weather event (and a rare November tornado in Columbia county) over Eastern NY State. The former paper I presented at the Northeast Storm Conference in Saratoga Springs in March 1999.
Enough of the reminiscing. Onto my "cleaning" project and my dilemma: What do I toss and what to keep? First I began condensing 'stuff'. I organized my binders into topics and then placed the articles that matched the topic into a LARGE loose leaf binder. My "tropical" weather folders were far and away the most in number. So I threw out a lot of papers, articles and booklets, especially articles from the 60s and even 50s. However, I did keep a couple from this "era". There was a paper on Hurricane Donna and its two eyes. This paper was procured for me by a very special and dear friend who knew how this hurricane started me on my road to my career in meteorology.
Tied for second place in the bloated folders and binders category were my severe weather and winter weather forecasting ones. Some of the papers were from the 1970 and earlier. Some of them were "old school" forecast techniques that are now no longer used (much). I at least for now can still recall the techniques and use them today if needed. Regardless, I threw many of them away. I also realized that in some cases, I had duplicates and even a few triplicates of articles and research papers. No sentimentalism here- this is an easy decision, toss them out!
The project that I was "shamed" into doing is now near complete, at least as far as the condensing goes. I lost track of how many vanilla folders I discarded in my cleaning but I do know I know that I now have 18 loose-leaf binders that I was able to clear out completely. (If anyone needs loose-leaf binders, let me know I'll give you a better deal than Staples!)
This project got me reminiscing of my days as a "amateur" weatherman. Definitely this will be another blog post in the not too distant future.
[I will be adding some photos soon!]
Oct 26, 2016
Another Accumulating snowfall for the Higher Elevations
Below is a forecast animation (from the Hi-Res WRF model) showing the expected development of the rain and snow across eastern NY State and western New England.
It looks like Thursday evening's commute home will be when the "worst" of the wintry weather will occur. Be safe if you must travel!
Oct 19, 2016
Sayonara Indian Summer, at least for now.....
Oct 2, 2016
Hurricane Matthew still remains a powerful storm
The latest satellite picture shows a well defined eye of about 10 nm in diameter embedded with in a feature called a Central Dense Overcast (CDO), the bright white circular ring around the eye (refer to image below).
The official NHC track has Matthew moving in a general north direction. Thus the center of Matthew will not make landfall on Jamaica and could even just pass to the west of Haiti. However, with tropical systems that move in a northerly direction the worst rainfall (and wind is to the right or east of the center. This means that parts of extreme western Haiti could experience hurricane force winds and will also likely receive very heavy rainfall. where amounts of 15-25 inches are forecast (even east to the southwest parts of the Dominican Republic) and some local amounts to 40 inches could also occur here. Needless to say rainfall totals such as these will likely produce catastrophic flooding and flash flooding. The eye of the storm is expected to make landfall on the east end of Cuba late Tuesday resulting in some slight weakening but even so Matthew is expected to remain a major hurricane as it moves across the central Bahamas during late Tuesday through Wednesday.
And by the end of this week Matthew is expected to be a few hundred miles off the Carolina's coastline. It is something that all of the East Coast states will have to watch, including all of us here in Upstate New York. I'll keep you posted.
Sep 28, 2016
Tropical Storm Matthew
Upper air winds are favorable for a steady development based on the latest high-level wind analysis from the UW-Madison Tropical Cyclone analysis page:
The area of unfavorable shear (image below) continues to recede westward ahead of Matthew's as the storm travels toward the west or slightly north of west motion over the next 72 hours.

Thereafter, once it nears 75° W longitude model data is forecasting Matthew to make a hard (anti-NASCAR) right-turn.
As the spatial separation increases between the storm and the coast of South America, the system is expected to intensify at a slightly faster rate; I think that during the post-72 hour period as the storm turns north there is the potential for it to undergo a period of rapid intensification. But again for now thinking/being conservative here.
At 11 PM Matthew was located approximately about 370 miles/595 kilometers SSE of San Juan, Puerto Rico or about 370 miles ENE of the Island of Curacao. Maximum winds were 65 mph with higher gusts and the storm was moving West at 15 mph.
Tropical Storm Warnings and Watches are posted for some islands in the Lesser Antilles and along the north coast of Venezuela.Time will tell what, if any, impacts Matthew will have on the U.S. mainland. Already, the internet is abuzz with wanna be meteorologists making unfounded posts of meteorological armageddon based on long range weather models. Make sure what you view online is from a credible source - either from the NWS, NHC or a credible meteorologist! Rest assured, I'll be keeping both eyes on this system.
Sep 27, 2016
Tropical Disturbance in Atlantic - Invest 97L
Based on satellite wind data and minimal surface reports the system doesn't appear to have a closed cyclonic circulation at the moment. Below is a visible satellite picture of the system on the left and the satellite winds on the right.
|
|
![]() |
| (Current Divergence Analysis) |
In addition to divergence, tropical systems need warm ocean waters Sea Surface Temperatures/SST) of at least 26°C/78°F for their development or intensification. The disturbance is currently over SSTs of 28°C to 30°C (image below).
![]() |
| (Sea Surface Temperature analysis) |
![]() |
| (Current Wind shear) |
The forecast model spaghetti plots for 97L are clustered around a W to WNW heading through the end of the week. Of these models that forecast intensity of tropical systems, most if not all are forecasting 97L to become at least a tropical storm. If this did occur then 97L would be christened "Matthew".
![]() |
| (Forecast model ensemble tracks for 97L) |
Aug 10, 2016
Prolonged Wet Spell Still Likely
.
From the US Drought monitoring service here is the discussion regarding the Northeast's drought:
"Moderate to heavy rains, locally exceeding 5 inches, fell on areas from southwestern New England southward and eastward into the mid-Atlantic and through the central Appalachians. These rains removed dryness and drought from most of West Virginia and in the mid-Atlantic south of the Mason-Dixon line, but only scattered improvement was noted elsewhere. In eastern and northern New England, where only light rain fell, severe drought expanded through most of Massachusetts, and moderate drought covered the rest of southern New England. Rainfall deficits for the past 90 days range from 4 to 9 inches in much of this region. In addition, long-term rainfall shortages remain entrenched, with accumulated shortfalls over the past 2 years of 12 to 24 inches observed from central New England southward into northeastern Pennsylvania. Temperatures averaged a few degrees above normal this past week, exacerbating conditions."
However there is going to be a definite pattern change as it relates to our dearth of rainfall. As I mentioned in my update A Drippy Looking Long Range, the next 7 days upcoming will feature frequent bouts of showery rains and thunderstorms with any shower or storm capable of producing torrential rain. Even though it has been dry and the rain will be absorbed by the ground, there is the chance that too much rain could fall in a short time period (like 2 hours or less) resulting in the threat for flash flooding. Definitely something to keep an eye on.
Here is the 7 DAY TOTAL AMOUNT of rain expected. (Forecast is from the Weather Prediction Center) It is for the 168 hour period from 8 AM Wed 10 Aug through next Wednesday, 8 AM 17 August:
The forecast map indicates a widespread 1.5-2 inch rain fall for us with more than a few locations getting 3 to even locally near 4". Keep in mind this the total expected rainfall for the next 7 days . BUT as for our region goes, I think that most of this heavy rain will occur in the Friday through Sunday morning period, with Saturday seeing the most rain.
Aug 7, 2016
A Drippy Looking Long Range
Severe weather possibility aside, forecast data is indicating some high (octane) moisture swirling our way from late Wednesday into the upcoming weekend. Forecast data is indicating higher than normal precipitable water (PW) content over the Northeast US during this time period.
What is precipitable water (PW)?
![]() |
| Forecast PW departures from normal for the period Aug 10th-14th |
How high is the question. Small scale/mesoscale features like thunderstorms: where do they form and how do they move could be factors in enhancing local rain fall amounts. Will these storms repeatedly form or move over the same locations? Other features like outflow boundaries (which are caused by convection) and their interactions with other large and small scale weather features COULD lead to some local enhanced heavy rain amounts, too. This in turn could perhaps cause some local flooding issues. The "small" and mesoscale systems are near impossible to predict days ahead but based on past experience, I think that they will show up as we get closer to the end of this week .
I'll be watching, as should you by keeping up on the latest weather forecasts.