Dec 8, 2014

Nor'easter Update

Latest data continues a trend of slightly colder and also much more moisture, that is, more precipitation. I am still looking at the potential for the area from Albany and points south through east to see snow at the start then a mix or change to sleet, pockets of freezing rain or a cold rain.

Areas to the west by north of Albany will see mostly snow and the higher elevations will easily see a foot of snow, if not more, thanks to the combination of elevation and colder temperatures along with upslope winds enhancing already strong lift.

Here is a comparison of this morning's 7 AM models from various national and international meteorological centers. Maps are from www.meteocentre.com


 The maps to the left are initial panels for the 4 main forecast models valid for 7 AM this morning (8 Dec). Clockwise from upper left to lower left your are looking at the CMC Global of GEM model, to the right is the US GFS model; bottom right is the UKMET office model and lower left is the European of EC model. The contour bands are the upper air contours for the 500 hPa level and thr black lines are the surface isobar.


The maps to the right are the forecast charts for the surface and upper-air valid for Wednesday morning 7 AM, 9 December 2014. All of the models are in very good agreement as to placing an intensifying low near or just off of the Mid-Atlantic coast. They all also show a strong "blocking" area of high pressure over Newfoundland. As you will see on the following forecast maps, this high remains nearly stationary. Thus the coastal storm cannot move quickly and this is why this storm will be a long duration event for the region.

The maps to the left are the forecast surface and aloft (500 hPa) for Wednesday morning 7AM December 10th. The UK and EC (bottom row of  maps) have the low very close to Islip Long Island. The GFS upper right has the low near the South Shore of Long Island (south of Islip) while the GEM (upper left) has the low over New York City.  Comparing the forecast maps from Tues morning to Wednesday morning you can see that the low both intensifies and moves very slowly while the high retrogrades west to over Quebec Province.

The maps to the right are the forecast maps for Thursday morning December 10th. The top two maps are from the GEM and GFS and both indicate the low lifting north toward Canada or Northern New England and weakening. The EC and UK indicate the low weakening but still lingering over south-central New England. For the past three days the EC and UK have been very consistent in their model output. For the forecast that follows, I have heavily leaned on these two models. 

The following map is the cyclone track map for the UK. 
UK Cyclone Track comparison last 2 runs

The EC is very similar, too. During the late fall and winter with a low forecast to track very close to the East Tip of Long Island more often than not Eastern NY State winds up with heavy precipitation; if t is cold enough this precip falls in the form of snow. With the high retrograding in time cold air will persist to the north and west of Albany and this will allow for predominantly snow to fall. With a low near Eastern Long Island warmer air especially aloft should result in snow mixing with or changing to rain and sleet to the south and southeast of Albany with a snow sleet rain mix up through the Berkshires, Capital District and the Eastern Mohawk Valley and Southern Saratoga County

For now here is what watches and warnings have been posted by the NWS:


The winter storm watch has been upgraded to a warning in places (lavender color regions). NWS is keeping the watch up for the Mid and Upper Hudson River Valleys and points east and has now added a Winter Weather Advisory for areas to the south through southeast of Albany. The flood watch remains in effect for the Lower Hudson Valley and NW Connecticut.

Storm Details
STORM HAZARDS:

Heavy precipitation

Heavy snow: across the Catskills and Hilltowns and Southern Adirondacks where accumulations will exceed 12 inches.

Heavy Rain: Lower Hudson Valley and NW Connecticut after a period of accumulating snow. Potential small stream and urban flooding

Wind:

Periods of gusty East winds with gusts to 40-50 mph possible across the higher terrain of the Catskills, Taconics, Berkshire and Green Mountains during Tuesday could cause blowing snow and perhaps some sporadic power outages.

START TIME: Daybreak Tuesday over the Lower and Mid-Hudson Valley, Capital District between 9AM and Noon with areas north of the CD between Noon and 3 PM

The snow and mixed precip will taper off some late tomorrow night then redevelop during the day Wednesday into Wednesday night. Expect lingering mostly snow to fall (lighter) during Thursday. Here is my snowfall map.

Its is forecast snow accumulation by Wednesday evening. There will likely be another couple to few inches overnight Wednesday into Thursday. There will also be some pockets of freezing rain especially when the snow begins to transition or change to rain. Right now some areas of ice accretion are possible but for the moment heavy icing doesn't appear to be a major concern.


Cyclogenesis of the expected  Nor'easter 
While not unprecedented it is not too often that a low to develops well of the East Coast and then moves northwest toward the coastline before turning to the north or northeast and head toward New England.

East Coast cyclones (low pressure systems) of a non-tropical nature are classified into three main groups. Miller A and Miller B systems as documented by J.E. Miller. Its a simple classification scheme: Miller (type) A lows develop over or on the Southeast US Coast or Gulf of Mexico often on stalled or slow moving cold fronts.

Miller (type) B lows can develop over the region from the Mid-Atlantic Coast to the New England coast. These are called "secondary lows". They form in association with an area of low pressure moving across the Lower Great Lakes or Ohio Valley. The low to the west is usually filling and the secondary low redevelops to the east usually on the primary low's warm front or at the "triple point" of the primary low - that is the point where occluded, cold and warm fronts meet.

The last type of low - which is how tomorrow's Nor'easter has developed  is called a "blocked low". This not too common of how a Nor'easter forms. This type of development has been documented by James Andrews in an article from Mariners Weather Log. Te low development sequence occurs when a strong high pressure area is over Canada, the Maritimes or Northern New England. The low develops well off the coast over warm Atlantic Ocean waters.

Due to the high "blocking" the low from continuing on an out-to-sea track, the low turns west or northwest around the high towards the East Coast.

Intensification of the low is possible as it moves across the Gulfstream waters as well as additional energy that exists because of the strong temperature contrast during the cool season between the chilly land and the warmer ocean.  Last, when a strong upper-air trough approaches from the west this further aids in the intensification process.  From Andrews' article in the Mariners Weather Log Look for the following to happen at the surface:

While in the upper atmosphere the planetary pattern or if you will jetstream is undergoing a "pattern change" that leads to the development of "cut-off" pressure systems surface and aloft (both high and low pressure). "Cut-off" systems tend to be slow movers.

Here are surface and upper air analysis for 7 AM 8 December 2014. The surface map shows a weak low well offshore to the east of the Carolina's Coast.

The 500 hPa map shows the approaching upper-air disturbance (dashed line over Central US) that will aid in the offshore storm's intensification.

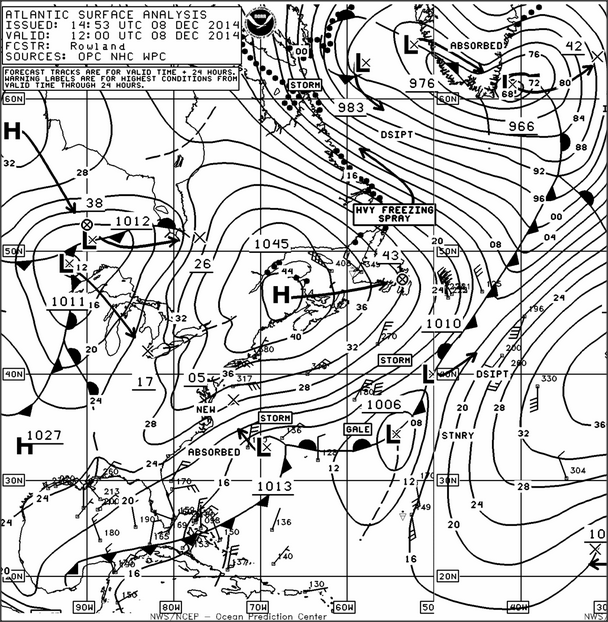
7 AM 8 Dec 2014 EST Surface map
7 AM 8 Dec 2014 EST 500 hPa analysis

Below are the forecast surface and 500 hPa charts for Tuesday morning 7 AM 9 December 2014. The low is a bit stronger and has now neared the Mid-Atlantic Coast. As the upper-air disturbance approaches from the west the winds aloft ahead of it are now out of the SSW and the surface low is turning toward the N or NNE.
Fcst surface map 7AM EST Tues 9 Dec 2014
Fcst 500 hPa chart 7AM EST Tues 9 Dec 2014

  By Wednesday morning 10 Dec a strong Nor'easter is near the NJ coast
Fcst Surface Map 7 AM EST Wed 10 Dec 2014
 While at 500 hPa the upper-air feature is strengthening and becoming "cut-off"

Fcst 500 hPa chart 7 AM EST Wed 10 Dec 2014
As the low aloft over takes the surface low and "captures" it, the whole system slows down. Resulting in what will be a long-duration storm.

References:

J.E. Miller, "Cyclogenesis in the Atlantic Coastal Region of the United States", Journal of Meteorology, Vol 3, No. 2, June 1946

J.F. Andrews, "Cyclogenesis Along the East Coast of the United States", Mariners Weather Log, Vol.7, No. 2, pp. 43-46

Major Winter Storm Heading Our Way

A complex , significant, slow moving and muti-hazard winter storm will affect the region from Tuesday through (at least) Thursday night. Even though the start time of the storm is now less than 18 hours from starting, weather data regarding the actual evolution and track of the storm is still uncertain.

The uncertainty in the storm's track will be VERY CRUCIAL in determining precipitation type. If the low tracks right along the coast towards New York City and western Long Islnad then precipitation, while initially starting as snow could mix with or change to sleet and rain in the Hudson Valley and points east late Tuesday and Wednesday; a slightly more east or offshore track to the storm will allow for colder air to remain in place and a mostly all snow will then fall.

One thing is certain about this storm it will have a lot of moisture associated with it thus precipitation amounts will be heavy. Where this precip falls as ALL snow, snowfall totals will be very high likely exceeding a foot with perhaps some areas near 2 feet possible. Right now the central and northern Catskills and the southern Adirondacks as well as the higher terrain to the west of Lake George appear to be mostly snow.

Elsewhere, snowfall amounts will range from a few inches across the lower Hudson Valley and northwest Connecticut to as much as 6-12 inches from about Hudson north (including the Capital District) to Glens Falls. Expect similar amounts to the east across Southern Vermont and the Berkshires. Its over these latter two locations where a better chance for snow changing to or mixing with rain or sleet could occur as temperatures here will be warmer.

The Hudson Valley region may be subjected to the snow mixing with or changing to sleet, freezing rain or rain. In addition "downslope" easterly winds may cause a “precipitation” shadow to develop here. If this were to happen then the air would dry and warm lessening the amount of preciptation. However if the shadow is NOT strong and warmer air doesn't allow for the snow to mix or change to rain or sleet then snowfall amounts here will be much higher.


The above map shows most of Western New England, Eastern and Central New York State under a Winter Storm Watch (WSW). In addition the Lower Hudson Valley and Connecticut while NOT under a WSW ARE under a FLOOD WATCH

STORM HAZARDS:

Heavy precipitation

Heavy snow: across the Catskills and Hilltowns and Southern Adirondacks where accumulations will exceed 12 inches.

Heavy Rain: Lower Hudson Valley and NW Connecticut after a period of accumulating snow. Potential small stream and urban flooding

Wind:

Periods of gusty East winds with gusts to 40-50 mph possible across the higher terrain of the Catskills, Taconics, Berkshire and Green Mountains during Tuesday could cause blowing snow and perhaps some sporadic power outages.

START TIME: Daybreak Tuesday over the Lower and Mid-Hudson Valley, Capital District between 9AM and Noon with areas north of the CD between Noon and 3 PM

END TIME:  When its finished...seriously very Late Thursday night.


I'll have more on the storm this evening as well as maps including a snowfall forecast, too.

Nov 19, 2014

Lake-Effect Snow

What is lake-effect snow?
Lake effect snows are a small scale (mesoscale) weather phenomena analogous to a thunderstorm in the summer. Like a thunderstorm they are convective in nature.

Where does lake-effect snow occur?
In general they occur on the downwind shores of the Great Lakes but also can occur over other regions of the world. The Great Lakes lake effect snows though tend to be the most prolific.


What causes lake effect snow?
The cause of lake effect snow is when very cold arctic or polar air moves across the warmer (unfrozen) Great Lakes. This cold air mass is made unstable by the warmer air over the Great Lakes causing the cold airmass to become very unstable. The greater the temperature difference between the water temperature of the underlying Great Lakes and the cold air mass moving across the lake, the greater the instability. This is called the air-lake (temperature) difference.


Sep 19, 2014

Last Night's Chill

Last night the temperature dropped to 33 degrees at my house.  For northern Herkimer and northern Warren counties and all of Hamilton County the growing season has come to an end, as temperatures last night, across these locations, dropped into the upper 20s to near freezing.

The weather this weekend will feature more seasonable to even above normal temperatures by a few degrees before another cool snap heads in for the first part of next week.

Aug 5, 2014

Tropical systems to threaten Hawaii..while Bertha threatens North Atlantic shipping lanes

Trop. Storm Julio
Tropical cyclone activity in the Pacific Ocean continues at above normal levels with the 10th named system, Tropical Storm Julio  located about 1145 miles to the SW of the Southern Tip of the Baja Peninsula. Julio is forecast to move toward the WNW over the next 5 days and slowly intensify to hurricane strength. Winds are currently near 60 mph this early Tuesday morning and are forecast to increase to near 85 mph by Friday morning then weaken to near 75 mph by Sunday morning.


NHC forecast track for Julio
Currently sea surface temperatures are very warm along the forecast path of Julio which has the storm located to the ENE of the Big Island of Hawaii by Sunday morning.

Major Pacific Hurricane Iselle
 Of greater concern for the Hawaiian Islands is MAJOR Hurricane Iselle. Early this morning Iselle was located about 1055 miles to the ESE of Hilo, Hawaii, moving toward the West at 9 mph. Iselle is a Category 3 hurricane (it was a CAT 4 storm yesterday) with maximum winds of 125 mph. Iselle is expected to weaken very slowly over the next 24 hours with a slight turn toward the WNW. It is possible that tropical weather watches may be required for (parts of) the Hawaiian Islands later today or tonight; for sure ALL interests in the Hawaiian Islands are advised to monitor the progress of Iselle. The forecast track for Iselle is fairly straightforward with the system expected to affect the Hawaiian Island during Thursday through Friday. The uncertainty is in how strong will it be when it does impact the Islands' weather.
Forecast track of Iselle

For now the potential for Iselle to be a strong tropical storm (with winds of 55-73mph) when it affects Hawaii is estimated to be about 70%; there is about a 20% chance that it could be a weaker tropical storm and a bout a 10% chance that it could still be a minimal hurricane.


Over in the Atlantic the second named tropical cyclone of the season continues to churn toward the north-northeast and out to sea away from the U.S. mainland  at a speed of near 22 mph. It is also weakening as increasing wind shear aloft continue to push the strongest convection toward the northeast, away from the lower-level circulation. Loop of Tropical Storm Bertha . The forecast track of Bertha calls for acceleration and continued weakening over the next 36 hours. After this time Bertha is expected to become a post-tropical or extratropical cyclone that will rapidly accelerate toward the east or east-northeast and perhaps affect Western Europe (Iberian Peninsula) and/or  the British Isles by Sunday.
Forecast track for Bertha

Aug 1, 2014

Tropical Storm Bertha forms to the east-southeast of Barbados

IR satellite picture of Trop. Storm Bertha

 An area of convection as flared up to the north and northeast of the low pressure circulation over the Atlantic Ocean located to the ESE of the Lesser Antilles. The organization of the system now warrants classification of the disturbance as a tropical storm - in this case  Tropical Storm Bertha. The NHC is now issuing advisories on this system
The storm is moving toward the WNW at 20 mph with maximum winds of near 40 mph. Environmental conditions currently around the storm's circulation and along its forecast path only favor marginal intensification.
Latest position/strength of TS BERTHA

"Spaghetti" model plots
The "spaghetti plots are tightly clustered on WNW track and the official NHC track is pretty much in agreement. Due to the expect WNW track at a rather brisk forward speed Watches and Warnings have been posted for parts of the Lesser Antilles and also across some islands in the Greater Antilles chain.
Official NHC forecast track for Bertha


Tropical Warnings/Watches currently in effect
A TROPICAL STORM WARNING is in effect for:
* Barbados * St. Lucia  * Dominica 
A TROPICAL STORM WATCH is in effect for:
* Puerto Rico * Vieques  * Culebra * U.S. Virgin Islands
* St. Vincent and The Grenadines

Jul 31, 2014

Potpourri Weather Post

Don't be surprised by today's storms


KENX radar
There could be a few thunderstorms today and they might be locally strong or marginally severe. Main threats for today: hail 1/2" to perhaps 1" in diameter, winds gusting 40-50mph, heavy rain and of course DANGEROUS cloud to ground lightning. One small line of storms is moving out of Eastern NY State (with a warning out for Washington and Saratoga counties in NY) to Bennington county in VT. More scattered cells are "popping" up farther to the west.  


31 July 12z Albany, NY Rawindsonde 
The reason for only a marginal threat 
of severe weather for today is that  CAPE (potential instability) is small, wind shear is moderate and lapse rates are weak as indicated by the morning "sounding" from Albany NY (which I modified for the expected maximum temperature and dew point for today [at the surface]). 


CHAP/RI computations for 31 July 2014 for Eastern NY State
Using the data I then "ran" the Convective Hazard Assessment Program or CHAP (also know as Ricks' Index or RI)  to gauge the probability of severe weather. An RI value of < 110 implies NO SEVERE thunderstorms while a value of 160 implies SEVERE thunderstorms are likely. The RI can also be useful in predicting potential hail size, maximum wind from the storms, radar VIL [storms that reach or exceed this value of the VIL could be severe] and rainfall. Today's RI = 116 so hail size could be around 1/2 or so, winds could gust to 40-45 mph. The Probability of Precipitation (PoP) for today is 40% with the Probability of Severe storms (PoSVR) is only 7%. Rainfall of around 8/10 ( 0.80") is possible in storms with MAXIMUM potential rainfall of 2". Storms will tend to move quickly towards the ENE at 30-35 mph, so I would think that the threat for any flash flooding from today's storms is LOW.

Atlantic Tropical Disturbance to the southeast of the Leeward Islands

From the National Hurricane Center
TROPICAL WEATHER OUTLOOK
NWS NATIONAL HURRICANE CENTER MIAMI FL
200 PM EDT THU JUL 31 2014

For the North Atlantic...Caribbean Sea and the Gulf of Mexico:

1. A Hurricane Hunter aircraft has recently begun investigating the
low pressure system located about 550 miles east of the southern
Windward Islands.  Preliminary reports from the aircraft indicate
that this system is producing winds to near gale force.  However,
satellite images indicate that the associated showers and
thunderstorms have diminished significantly since this morning.
Therefore the low currently does not meet the criteria to designate
it as a tropical cyclone.  Showers and thunderstorms could
redevelop later today or tonight, which could result in tropical
cyclone formation.  Interests in the Lesser Antilles should continue
to monitor the progress of this disturbance as it moves
west-northwestward at 15 to 20 mph, and watches or warnings may be
required for some of these islands later today or tonight.
* Formation chance through 48 hours...high...70 percent.
* Formation chance through 5 days...high...70 percent.

Forecaster Pasch

Visible Satellite picture of tropical disturbance 93L

Model forecast tracks for tropical disturbance 93L


Jul 20, 2014

Derecho expected for the Northern Plains and Western Great Lakes

This upcoming week will feature some significant and widespread heat and humidity from the east facing slopes of the Rockies to the East Coast. The weather setup for this week  features a sprawling high pressure area surface and altof , acting like a heat pump, extending from the Southwest States to the Great Lakes.


The image to the left is the 500 hPa level (approximately 18,000 feet above the surface of the earth) from Sunday morning 20 July 2014  8AM EDT. The solid black lines are forecast heights. (An upper air chart such as this is called a constant pressure chart; on the chart the pressure is 500 hPa but the 500 hPa pressure is "located" at a different "height" above ground.) Think of upper-air maps as a topographic map of the atmosphere. The solid black lines are the actual heights of the 500 hPa and also can serve or approximate the the direction of the the winds aloft at near 18,000 feet. The distance between these contours can also approximate the wind speed -in general the closer the distance between any two contours, the stronger the winds and the greater the distance between the contours then the lighter the winds. The center of the "heat" producing high is located over southwest New Mexico with an elongated axis of higher heights extending to western South Dakota. From the Pac Northwest States to northern Wisconsin, a flow of air bringing some Pacific moisture prevails along with embedded disturbances that will cause ascent or lift.

The combination of all of these above features is expected to cause a significant severe weather outbreak across the Northern Plains to Wisconsin during Monday into Tuesday morning (July 21-22). Here is the severe weather outlook from SPC for Monday 21 July. The severe weather will initially start over the the border region of North and South Dakota with Montana as scattered but intense supercells during Monday afternoon, capable of producing severe hazards of damaging winds, large hail and a few tornadoes. These supercells are then expected to merge into a strong progressive derecho over the eastern parts of the Dakotas and then move rapidly east across and towards Minnesota to Wisconsin by late Monday night into Tuesday morning.

This derecho is expected to cause extremely strong winds of hurricane force (75 mph) or more in places along its path. The remnants of this system may also  redevelop and perhaps affect our area during Tuesday night, though probably not as intense. Often times these derecho are "episodic" in nature, that is they tend to develop on consecutive days and may even form over the same geographic region or move across the same region as the predecessor derecho did. Progressive derechos during the summer tend to form and become quite intense during extreme heat and or heat waves. The pattern for the development of these derechos is often referred to as "ridge-rollers and the ring-of-fire"

Jun 28, 2014

Potential for Tropical system off the Southeast US Coast

An area of disturbed weather off the the Southeast U.S. coast has been designated (disturbance) 91L by the National Hurricane Center. While not a true warm core system - yet - it will develop a warm core over time. Pic 1 is the location of the low and the convection associated with it.
Pic 1
  
 As you can see the the area of lowest atmospheric pressure is removed from the area of strongest convection. This is a satellite signature of unfavorable wind shear aloft which leads to a very disorganized system.


Pic 2

The model tracks for this nascent system are displayed in (Pic 2). There is a lot of "scatter" (basically in two clusters):  one group/cluster tracking the system toward the SW, while the other is on a track toward the SE. So a forecast S-SE motion is forecast. likely.


Since the motion is toward the south -  and south moving tropical systems tend not develop much or only very gradually (in the northern hemisphere) - only a slight or low probability (Pic 3) for development of this system is expected over the next 48 hours. 

Pic 3

If the system should intensify and attain sustained wind speeds of 40 mph or more then it will be "christened" with the name Arthur.

Jun 24, 2014

Northeast LIVE streaming radar and current temperatures.


Polygon key: RED = Severe Thunderstorm Warning PURPLE = Tornado Warnings BLUE = Special Marine Warning GREEN = Flash Flood Warning

May 1, 2014

April Weather Summary - BELOW normal again !

Here in Albany, April was another month of BELOW normal temperatures. The monthly summary indicates a slightly below normal month on both precipitation and temperatures.
The monthly average temperature was 47.4° or 0.4° BELOW normal This is now the 6th consecutive month where the average temperature for Albany has been BELOW normal. The last time Albany recorded six straight months of below normal temperatures was during the period of September 1993 through March 1994! (The monthly summary for Albany is to the left).

The April summary for some other locations: Bennington, VT - Average monthly temperature 45.3° or - 0.2°; precipitation 2.46" or .81" BELOW normal.  Glens Falls, NY - Average monthly temp was 46.6° or 2° ABOVE normal. This above normal month for Glens Falls was the first one since October of 2013. precip was 2.82" or -.18" BELOW normal. For Pittsfield, MA the average monthly temperature was 43.7° or a half degree BELOW normal. This the 4th consecutive month of BELOW normal temperatures for this location.

May Preview for Albany: 

   30-YEAR AVERAGE FOR MAY (1981 - 2010)          
                                                     HI      LO     AVG   PRECIP   SNOW
                                                     69.4°   47.1°   58.3°   3.61"        0.1"
Albany extremes for May  WARMEST    COLDEST      WETTEST       DRIEST     MOST SNOW
                                       67.0° 1826    50.4° 1967     8.96" 1953     0.15" 1903       5.4" 1945 
The warmest temperature observed in May: 97° on the 22nd in 1911. The coldest: 26° in 1968 on the 6th. Also the highest peak wind gust ever observed in Albany occurred in May on the 31st in 1998 during a severe weather outbreak (which included a tornado at the airport when this peak wind was recorded as well as the Mechanicville F3 tornado). Yes severe weather season starts here in the Capital Region in May. Best to be ready for it now!

Mar 16, 2014

Meteorological Uncertainty


Uncertainty exists in many things in life and the atmosphere is no exception. No specific weather event is "sure" or "certain" to happen. The final outcome of a weather event is one of an infinite number of possibilities.
A weather forecast can be made using deterministic models and it can also be made using probabilistic data.
First a brief discourse on weather "models". (These models are called "computer guidance". Guidance as such is just that: you can accept it,use it as you deem fit or you can ignore it all together.)
Computer models used in weather forecasting (also called numerical weather prediction or NWP) take an initial state of the atmosphere - observations from the ground and aloft and then ingest this data into powerful computers to predict future atmospheric conditions. These predictions are done using various equations of motion, thermodynamics and physics and calculated in a 3-dimensional array. The main deterministic or operational models used in forecasting are called the GFS, ECMWF (EC), UKMO (UK), GGEM and NAM. The last mentioned model and the first are models of the USA. GGEM comes from the Canadian Met Service, the EC from the European Center for Medium range Weather Forecasting and the UKMO comes from the United Kingdom (Great Britian) and the British Meteorological Office.
After these models finish all the calculations and come up with their expected forecast output of how the atmosphere will change over time, the initial conditions/observations are then used again in ensemble models. The GFS, ECMWF, GGEM and NAM have ensemble models run for them. But ensemble models don't use the SAME EXACT initial conditions, rather the initial conditions are slightly altered for each ensemble member.
By altering these conditions an ensemble can show another possible outcome to a forecast weather event. Again keep in mind what actually happens with respect to a weather event is ONE of an infinite number of possibilities, so by using ensembles an attempt is made to "forecast" other "possible" outcomes to an event. Thus if ensembles are "clustering" around one possible solution then there is a distinct possibility that MAY very well be what happens.
The more that the ensembles cluster around a solution (e.g., a storm may directly hit us, miss us or give us just a "glancing" shot) and if they are closer to the deterministic or operational model then a forecaster's confidence in a weather forecast/event is much HIGHER than if the ensembles show little clustering. When the latter occurs confidence is much lower than average. There are even cases where the ensembles may cluster around a completely different solution than what their deterministic counterpart has!
The thing to know about NWPs and ensembles is that they are sensitive to the initial conditions. Errors in the initial analysis are carried forward in time. The errors in the initial analysis increase as the data is "projected" farther out in time (e.g., days even weeks, forward). This why weather forecasts beyond 4 days can have varying degrees of uncertainty or "hedging" attached to them. This is why as a meteorologist we can assign both a possible probability of occurrence to an event and a confidence level such as low, moderate, or high (in both short term and long term forecasts).
In addition NWPs can have difficulty during times of "pattern changes": let's say the current pattern is one of a high amplitude flow, that is, the jet stream resembles a giant "sine" wave with large and amplified high and low pressure areas. Now let's say the pattern is forecast to change to a "zonal" flow; that is the jet stream takes on a more west to east orientation with the highs and lows having much less amplitude to them. (Even a zonal flow pattern can wreak havoc on the NWPs with timing the arrival and departure of weather systems (lows and highs), especially the farther out one goes with the forecast.
The state of the science (sometimes) does not permit more from a forecaster saying "We just have to keep an eye things" about a particular weather event many days ahead (sometimes even for the next day's weather - I'm thinking especially about severe weather during the late Spring and Summer). Frustrating yes! This is why meteorologists should convey this confidence (or lack of)  factor to the end user. Perhaps a more probabilistic forecast would better serve the end user.
Because of the potential uncertainty involved in longer range forecast (let's say over 7 days, especially for days 5 through 7 of a 7 day forecast) the end user, the viewer, should look at the latter part of a 7 day forecast more as a probability of occurrence versus an absolute or deterministic forecast.
The state of forecasting IS actually getting better but I really doubt there will be a totally perfect forecast made anytime soon day in day out. I remember a sage meteorologist saying to me way back in my college days, "The atmosphere is capable of doing whatever it wants, when it wants. We can out forecast it at times and at other times we can't. Just accept being humbled and learn from what went wrong this time, so that there won't be a next time."

Mar 15, 2014

4.5 Months in a row of BELOW normal Temps and counting...

The last time Albany had 5 consecutive months of BELOW normal temperatures was during the period October 2002 through February 2003. So far  through the first 14 days of March the huge BELOW normal temperature departures continue.

Here some average monthly temperatures from around the region through 14 March.


Location

Norm
March Temps

Average March 2014

Temps thru 14th

Departure from

Normal

Albany, NY

31.7°

23.2°

-8.5°

Glens Falls, NY

27.8°

16.9°

-10.9°

Bennington, VT

30.2°

21.0°

-9.2°

Pittsfield, MA

28.9°

21.0°

-7.9°

Poughkeepsie, NY

33.8°

27.4°

-6.4°


If the month ended on the 14th, it would be Albany's SECOND COLDEST MARCH ever! Here is a link to the all time   .

Looking Ahead
Longer Range data tends to indicate a continuation of colder than normal temperatures  through the end of the month. While there will be a day or few of near or even ABOVE normal temperatures the overall outlook is for BELOW normal temps on average. Bear in mind that the average high temperature increases about 1° / every 2 days by the 31st when the normal daytime high is 51°.

The 6-10 day and 8-14 day temperature outlook from the CPC for Albany calls for more BELOW colder than normal temperatures. For the 6-10 day period 47% chance for below normal temps, 20% chance for ABOVE normal and 33% chance for near normal temperatures. For the 8-14 day period (March 23rd through 29th) the chance for BELOW normal temps is near 80% probability of occurring.

Looks like we'll still be waiting for Spring!

Mar 1, 2014

Good-bye (meteorological) winter Hello (meteorological) Spring

Ahhh March 1st...the start of Spring! Well at least to meteorologists. Meteorologists divide the seasons of the year into quarters for ease of bookkeeping. Thus the months of December-January-February comprise Winter and the months of March through May make up Spring.

February 2014 recap for Albany:  February was one of the colder months that we have seen a long time. The average monthly temperature was was 21.9°, that is 4° BELOW normal.  Again another below normal month (4th one in a row) for Albany. Again way below for February, but NOT a top 10 Coldest February. All 28 days had low temperatures at or below 32° and 3 days had nights at or below 0°. Eighteen days had a high temperature of 32° or lower. As for snowfall it was way above normal during this past February: 28.1" the 7th snowiest February on record for Albany; snowfall records go back to 1884. The complete (preliminary) monthly summary for Albany, NY can be found at this link Feb 2014 Monthly Summary

Winter 2013-2014 summary for Albany:  The average winter temperature for the period 1 December 2013 through February 28 2014, was 23.1° or 2.5° below normal. It was a wetter than normal winter too with total precipitation of rain and the water equivalent of the melted snow totaling 9.17"; that's almost an inch and a half (1.45" to be exact) ABOVE normal. As for snowfall the 1 Dec through 28 Feb saw 63.1" of snow fall. This is above normal for this three month period by 19.4". Including November's snowfall the seasonal snowfall for Albany is 65.2". Normal snow fall for Albany is 59.1"  A more detailed (preliminary) Winter 2013-2014 summary for Albany NY can be found here: Winter 2013-2014 Seasonal Summary for Albany

March Climate preview for Albany: For starters the hours of daylight increase! :-) The average high and low temperatures are 39° and 21° respectively for the first few days of the month but for the last 4 days of the month the average high is 50° or 51°! The minimums by month's end are 31°.  March as we all know can be a fickle month for sure with weather extremes of cold and snow to warmth. Of Albany's top 20 snow storms 3 have occurred during this month with the first and second most snow fall ever from one storm having happened during this month. (#1 The Blizzard of 1888 and #2 The Storm of the Century or Superstorm of March (13th) 1993).

The warmest month of March on record was just 2 years ago when the average monthly temperature was 45.9 degrees, a staggering 14.9° ABOVE normal. We'll see what this March brings. As of now it looks like a colder than normal start with temperatures moderating by the end of the first week to at closer to if not AT normal.

For additional climate information not only for Albany, but for Glens Falls, Poughkeepsie, Bennington and Pittsfield is another link: Climate Data


Feb 28, 2014

Sunday Night-Monday's Snow Threat

We're going to see snow during this time period, well at least some of us will. Latest data continues the trend of suppression of the area of precipitation toward the south. Cold arctic air is the reason why the area of wintry weather will more south versus north.

Right now most of the deterministic models bring measurable precipitation up to an approximate Buffalo-Saratoga Springs-Arlington, VT line. The image below is from the Weather Prediction Center's Winter Weather page. I tend to be in fair agreement with their forecast as it relates to the forecast probability of 1" snow fall by 7AM Monday morning 3 March. The area in green has a < than 30% chance of seeing 1" snow, the three blue bands are probabilities ranging from 40-50% across the CD, to 50-60% just to the south of the CD and 60% or better in the aqua blue across the central and southern Catskills Mid Hudson Valley east to the southern Berkshires.


What the above map also indicates is both the very sharp cutoff between accumulating snow and little or no accumulation and that areas to the south of Albany have a better chance of seeing more snow accumulation.

The snow probabilities for snow fall exceeding 4" range are shown below.
 The greatest probability for snow exceeding 4" is about 20% or so along the NYS Thruway-Mass Pike (I-90) increasing to 30%-50% across the Southern Catskills-Lower Hudson Valley- southern Litchfield County CT line.

Again any shift north or south of the lows track by as little as 30 miles will alter these above (threshold) probabilities either up (low tracks more north than forecast) or down (low tracks farther to our south than forecast so lesser snowfall).

While it is still way too early to come up with numbers, my confidence is growing that in terms of a general accumulation:

1)  areas now north of a Buffalo-Saratoga-Arlington line snow amounts will be very light and this area may not see anything at all.
2) Working south from this line at least a few inches will fall

3) with the potential for a moderate perhaps marginally heavy snow of  > 8" but less than a foot for the southern Catskills-Lower Hudson Valley, Southern Taconics

Needless to say things can change, regardless I and my colleagues will keep you posted on this system throughout the weekend.

Feb 26, 2014

Winter 2013-2014 compared to winters past

So far much of the nation has been experiencing a good "Old Fashioned" winter.

First when meteorologists talk about seasons, for bookkeeping purposes we divide the year into 4 quarters, with each of the respective seasons being three months long. Thus Spring is comprised of the months of March, April and May; Summer: June, July and August; Fall: September, October and November; Winter: December through February.

Since November of 2013 Albany's average monthly temperatures have been below normal. The monthly departures from normal are: Nov -2.5°, Dec -0.9°, Jan -2.9 and so far for February (through the 25th) -2.7°

The last time Albany had four or more consecutive months of below temperatures spanning the Fall and Winter months was for the period from October 2002 through February of 2003. A span of 5 months. So far for from November 2013 through February 2014 we are below normal for 4 straight months.

So far Albany's average temperature for this winter (through February 25th) is 23.3° The normal winter temperature is 25.6°

From the NWS Albany climo site here are the Top 10:

The winter thus far, while colder than normal, is not even in the TOP 10 coldest. Another note, as cold as it has been NO record low temperatures have been set either!

Snowfall

For February 2014 (through the 25th) Albany's monthly snow fall is now 27.9" this is now the 7th snowiest February on record for Albany below is the current top 10 snowiest Februaries. Snowfall records go back 1884

The seasonal snow fall total so far is 65". The normal snowfall for Albany is 59.1"


On Saturday March 1st will start "meteorological" Spring. Here are some weather stats for the month:
Monthly Average Temperature 35° Precipitation:3.21" Snowfall: 10.2" Just an aside on March snowfall of Albany's Top 20 Snowstorms on record 4 have occurred in March.
We'll see what March brings as far as the weather goes. In looking at the long range weather data it does look like the month will start a lion along with more BELOW normal cold.